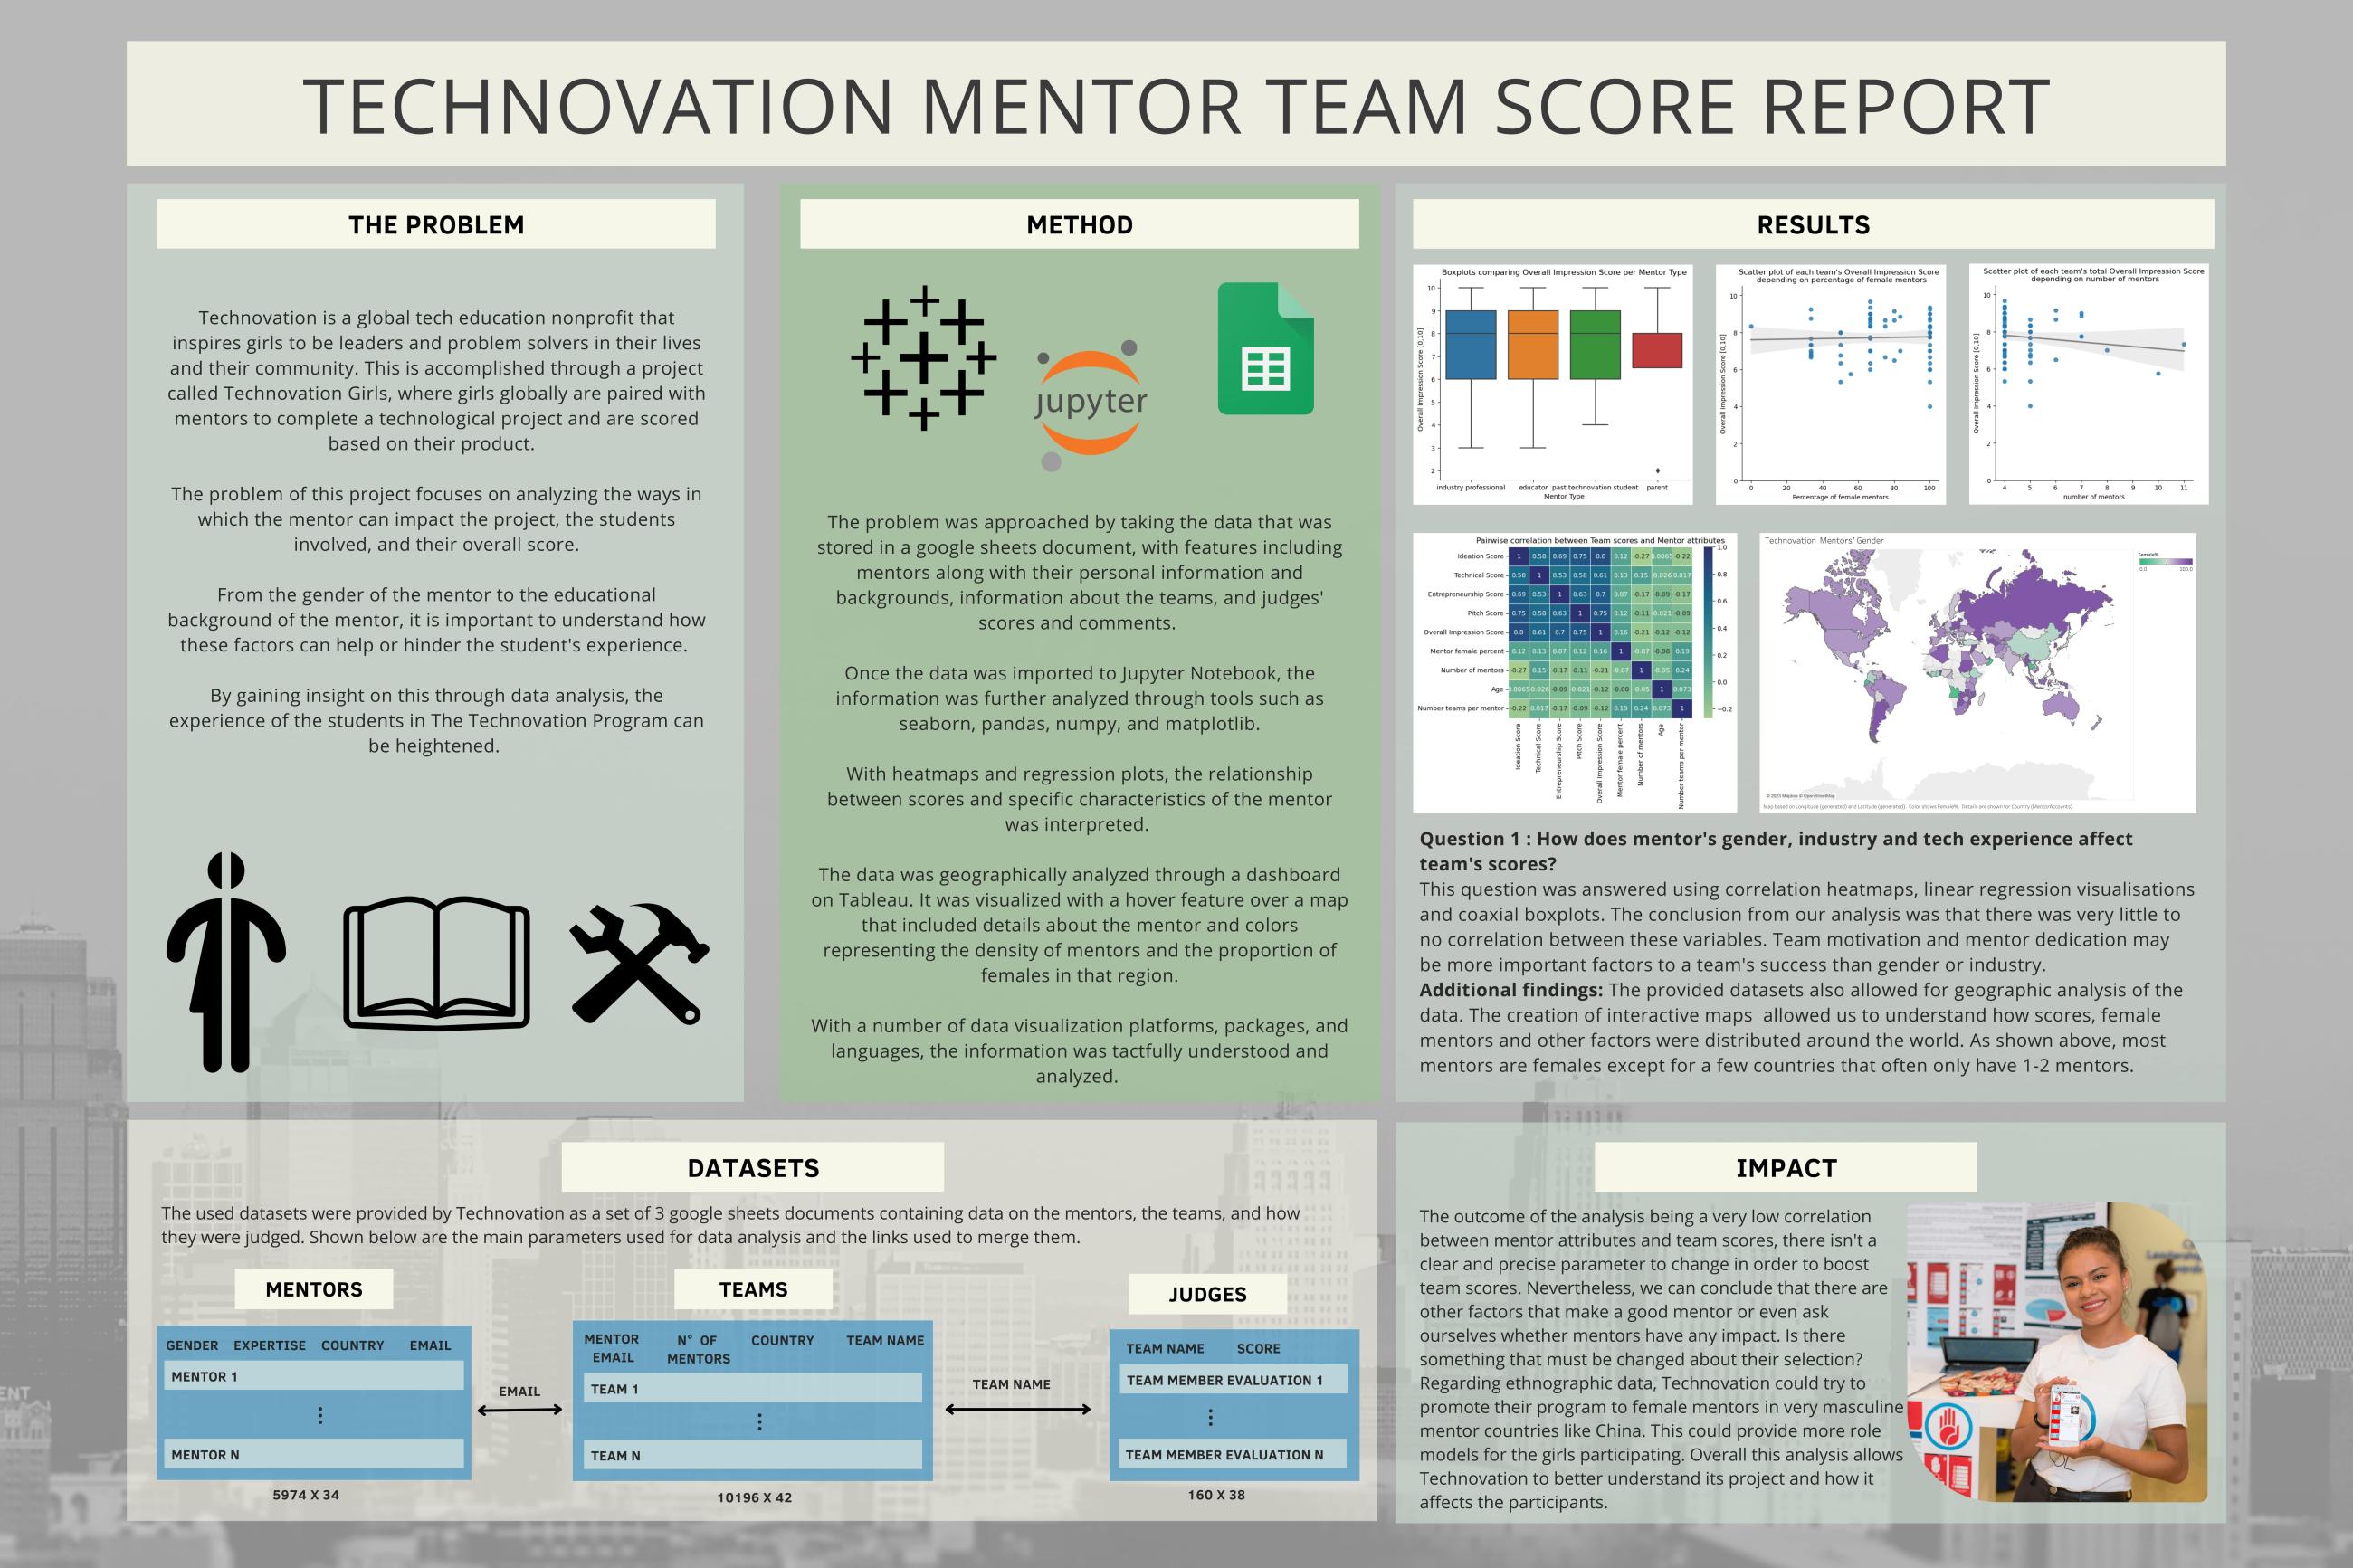
Technovation has been running for 17 years and has engaged ~400,000 participants to date across 120+ countries. We would love to have an annual dashboard that pulls various types of impact data from different sources to provide a snapshot of impact (learning). Here are the different types of data that we would like to collate (with some sample questions to guide):
Our own Platform data
- Who is more likely to finish the program and what distinguishes them from the others?
- Analysis by country, mentor profile (industry, educator, parent, alumnae, returning), expertise
Survey data (students, mentors, alumnae) - compared to previous years
- What did students and mentors learn and how do the key learning changes compare to previous years? Where were the biggest changes?
- What did alumnae learn through workshops?
Live sessions
- What was the impact of the live sessions on students and mentors?
Judges scores
- Is there any change in app quality compared to previous years?
Chapter ambassador surveys
- What is the impact of Technovation on a chapter ambassador’s life and community?
Student ambassador survey
- What is the impact of Technovation on a student ambassador’s life?
World Summit
- What was the impact of the world summit on participants?
Another project that we would be curious to explore would be to use OpenAI's tools to automatically score https://youtu.be/zo_WJ2e9hXA

Term
Spring 2023
Topic
Data Visualizations
Platforms/Infrastructure
Technical Area(s)
Geographic information system (GIS)
Machine Learning (ML)
Natural language processing (NLP)
Featured
Off
